Presidential Elections and Stock Markets
October 3, 2016 | By Kevin Smith, CFA
We naturally receive quite a few questions about investing with regards to the upcoming Presidential election, and as you might expect given the polarizing nature of the candidates, the concerns about potential market declines usually align with the political leanings of the concerned party. Trump supporters more likely fear the potential negative effects on market performance if Clinton wins, and visa versa. A Google search on the topic will yield some claims at predictable patterns of market returns in the months following elections, but we do not find such analyses to be convincing, given the small amount of data (one data point every four years) and the apparent random distribution of outcomes.
The following illustrations provided by Dimensional Fund Advisors may help put this in perspective.
Exhibit 1 shows the frequency of monthly returns (expressed in 1% increments) for the S&P 500 Index from January 1926 to June 2016. Each horizontal dash represents one month, and each vertical bar shows the cumulative number of months for which returns were within a given 1% range (e.g., the tallest bar shows all months where returns were between 1% and 2%). The blue and red horizontal lines represent months during which a presidential election was held. Red corresponds with a resulting win for the Republican Party and blue with a win for the Democratic Party. This graphic illustrates that election month returns were well within the typical range of returns, regardless of which party won the election.
Exhibit 1. Presidential Elections and S&P 500 Returns
Histogram of Monthly Returns, January 1926–June 2016
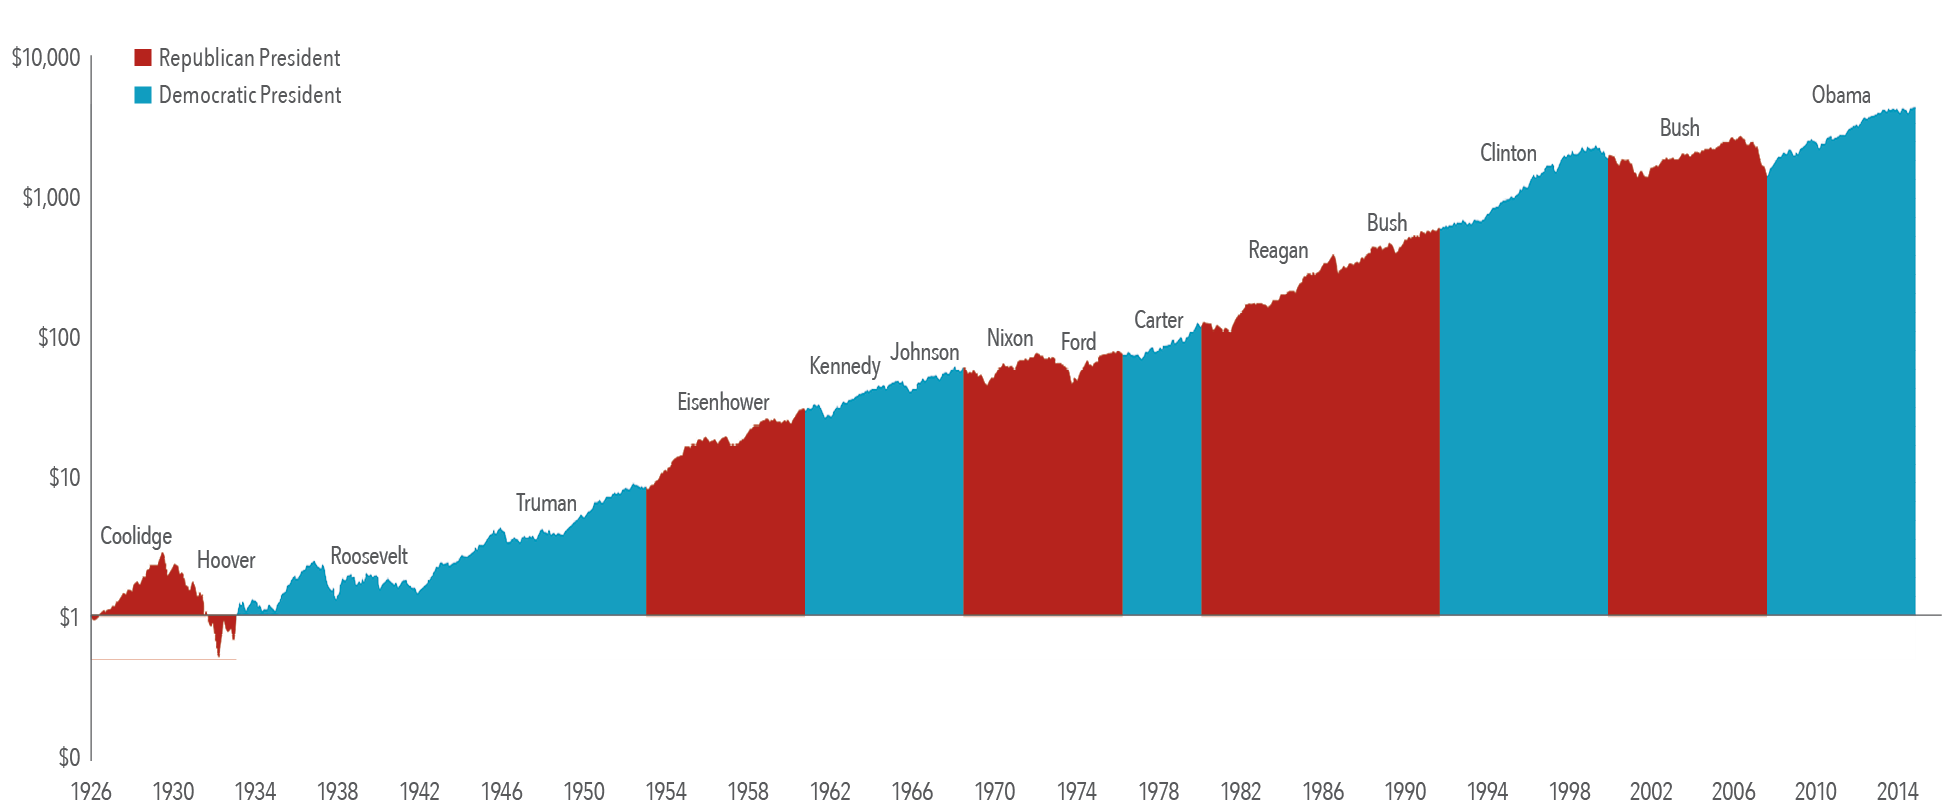
Predictions about presidential elections and the stock market often focus on which party or candidate will be “better for the market” over the long run. Exhibit 2 shows the growth of one dollar invested in the S&P 500 Index over nine decades and 15 presidencies (from Coolidge to Obama). This data does not suggest an obvious pattern of long-term stock market performance based upon which party holds the Oval Office. The key takeaway here is that over the long run, the market has provided substantial returns regardless of who controlled the executive branch.
Exhibit 2. Growth of a Dollar Invested in the S&P 500, January 1926–June 2016
Stock markets can help investors grow their assets over the long term. Attempting to make investment decisions based upon the outcome of presidential elections is unlikely to result in reliable excess returns for investors. At best, any positive outcome based on such a strategy will likely be the result of random luck. At worst, it can lead to costly mistakes. Accordingly, there is a strong case for investors to rely on patience and portfolio structure, rather than trying to outguess the market, in order to pursue investment returns.
Our conclusion is that investors will be well-served to discount their intuitions about the market impact of election results (and political events in general, ex: Brexit, US gov’t shutdowns, fiscal cliffs, foreign military operations, etc), and stick to executing a disciplined long term investment strategy focused on efficiently harvesting diversified market gains and the more convincing market premiums (ex: relative value factor, quality/profitability factor, momentum factor, small cap factor).
Source: Dimensional Fund Advisors LP.
Return to Blog Page

