
Our Blog
Expert insights and practical advice on financial planning, investing, taxes, and wealth management.

SpaceX IPO: What Investors Need to Know
SpaceX is going public in one of the largest IPOs in history. Austin Wealth Management breaks down the valuation, the risks, and three investing scenarios — from pre-IPO allocation to long-term index exposure.

Trump Savings Accounts
The 2025 passage of the One Big Beautiful Bill Act introduced the Trump Account, a unique custodial investment tool designed to jumpstart savings for young Americans. For nearly three decades, families have relied on 529 plans...

Accessing Your 2025 Tax Documents
Your 2025 tax forms are available for download from Charles Schwab. If you opted to receive your tax documents by mail, they should arrive soon. How to Access Your Tax Forms Online: Charles Schwab Client Portal...

Charitable Giving 101: A Beginner's Guide to Tax-Smart Donation Strategies
The holiday season is upon us, and with that often comes a desire to give back. Whether through volunteering your time, sharing your expertise, or donating resources like clothing, food, and money...
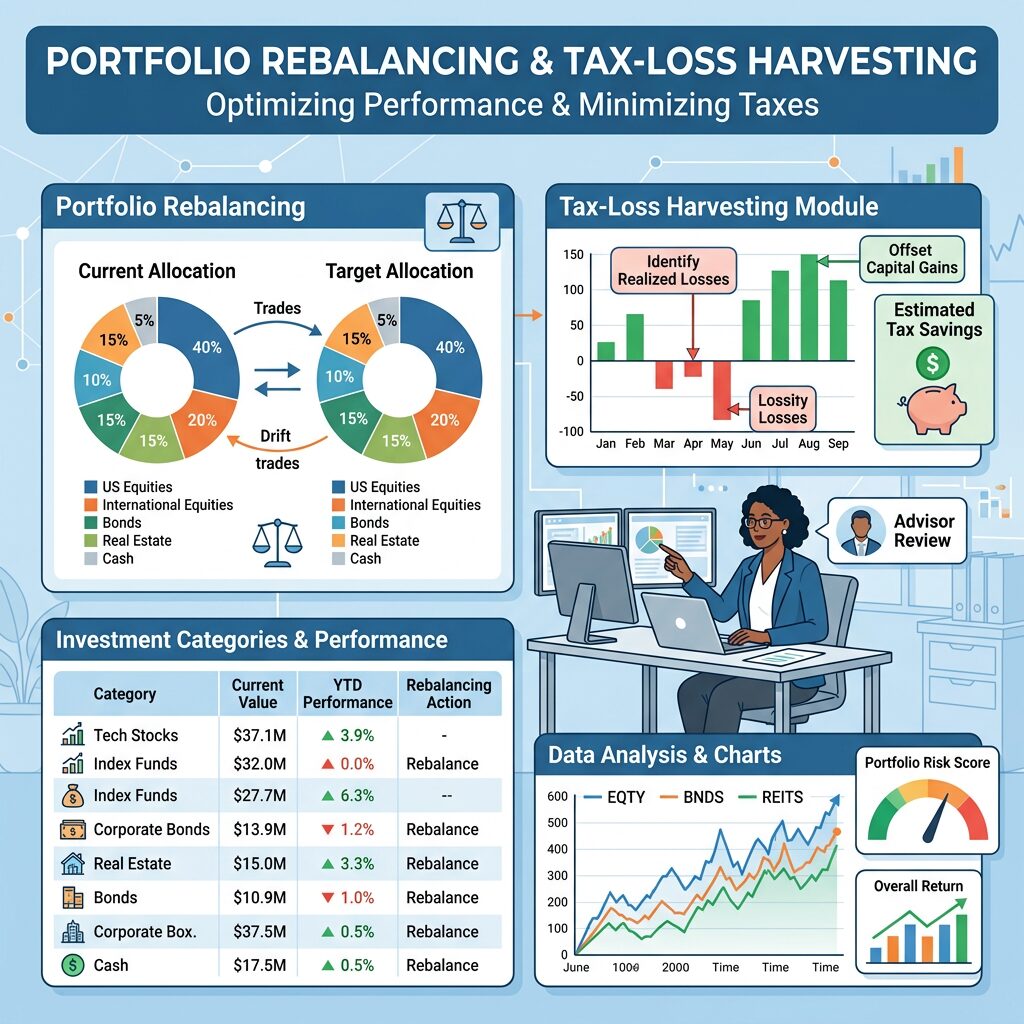
How Portfolio Rebalancing and Tax-Loss Harvesting Help Austin Wealth Management Improve Client Outcomes
Behind every AWM advisor is a dedicated team of investment professionals meticulously looking at each client account and watching for opportunities to improve our clients investment performance...

New 2026 IRS Limits: Bigger Breaks, Bigger Planning Opportunities
The IRS and Social Security Administration have released key numbers for 2026, including new federal income tax brackets, a higher standard deduction, bigger retirement and HSA contribution limits...
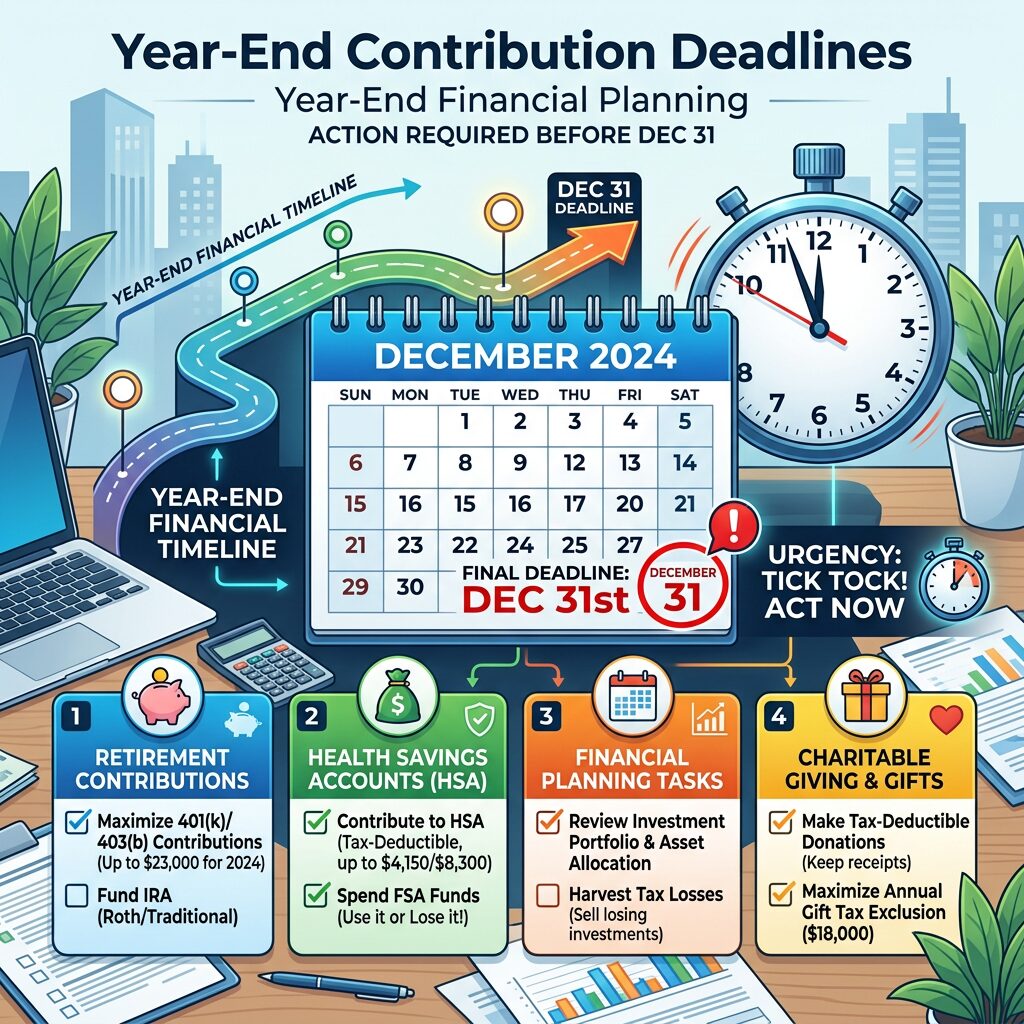
Final Countdown: Your Year-End Contribution and Transaction Deadlines
December is a good time to review deadlines for contributions, distributions, charitable giving, and account updates. Many account actions must be completed before December 31...