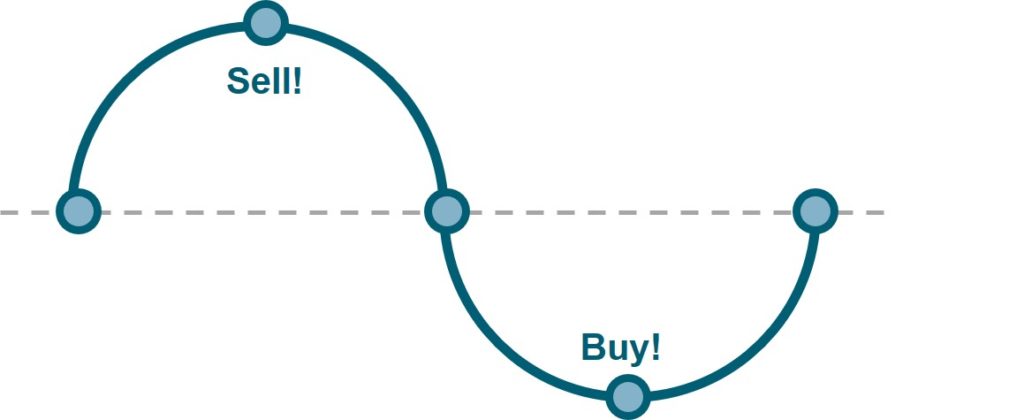
Strategy Breakdown: Selling the Highs and Buying the Dips
May 6, 2019 | By Kevin Smith, CFA
- Makes sense. Hard to argue against.
- Easy to apply (in theory).
- Low cost to execute.
- High profile investors have endorsed it.
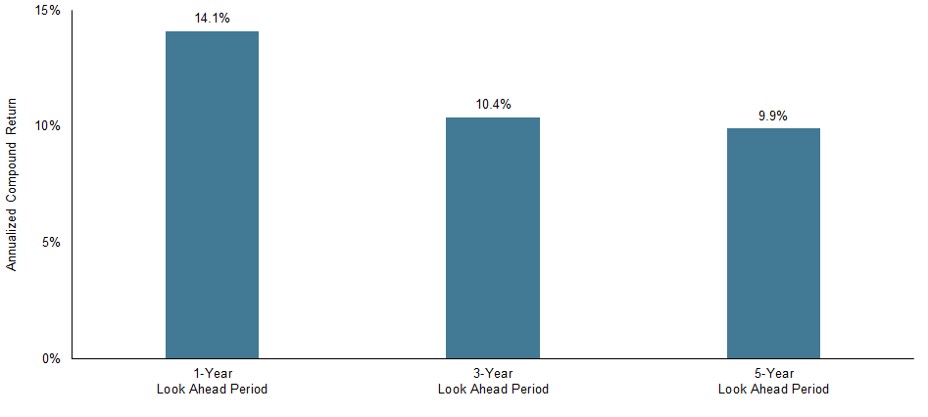
As with so many investing ideas, the data is sobering. There is no doubt this strategy has generated incredible results at times. For example, we took advantage of the December 2018 ‘dip’ and have seen positive results from it so far, but the average results over history are not reliably impressive. The charts below show the subsequent average annual performance of the market after new market highs (left) and after 10% market dips (right). You can click on them to enlarge the images. The bottom line? New market highs and 10% dips don’t tell us much, if anything, about what is going to happen next.
Selling the New Market Highs
Data source: S&P 500 1926 – 2018
Buying the 10% Dips
Data source: S&P 500 1926 – 2018
So, why doesn’t this strategy work consistently? The easiest explanation is market prices move with momentum in part because of the herd behavior of investors. This means all-time highs are often followed by more all-time highs. If you sell at a market high, you often give up on the subsequent gains on the way to the next market high.
Return to Blog Page


