
US vs The World
September 5, 2018 | By Kevin Smith, CFA
Stock markets have exhibited some fascinating behavior this year, and I’m not just talking about Elon Musk tweeting Tesla’s price up and down. (Although I can’t wait for the movie to come out – DiCaprio was born for that role.)
I am referring to the recent great divergence between stock market returns in the US and Canada compared to the rest of the world. As investors we have to decide what to do with that information. Allocating stocks across the globe is an important part of managing investments and the consequences can be life changing in the long run.
Investing in the rest of the world means investing in stock markets other than those in the country where we live. Let’s start by getting familiar with countries and companies that influence the broad categories of global stock markets, typically divided into: US & Canada, other countries with developed markets, and countries with emerging markets. An emerging market is technically defined as an economy with low to middle per capita income.
Largest Country Allocations as of 7/31/2018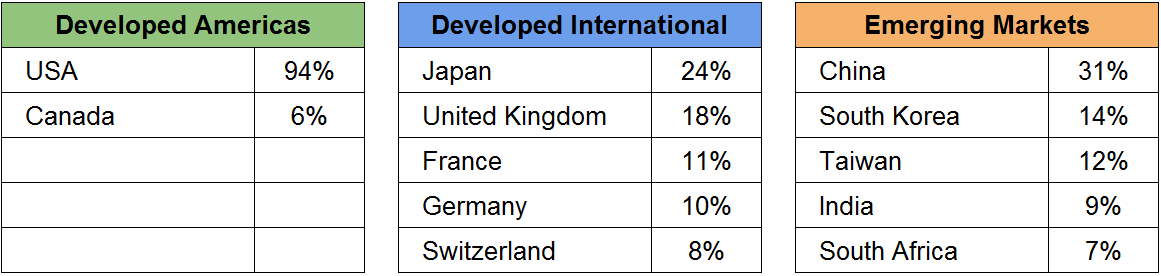 Largest Company Allocations as of 7/31/2018
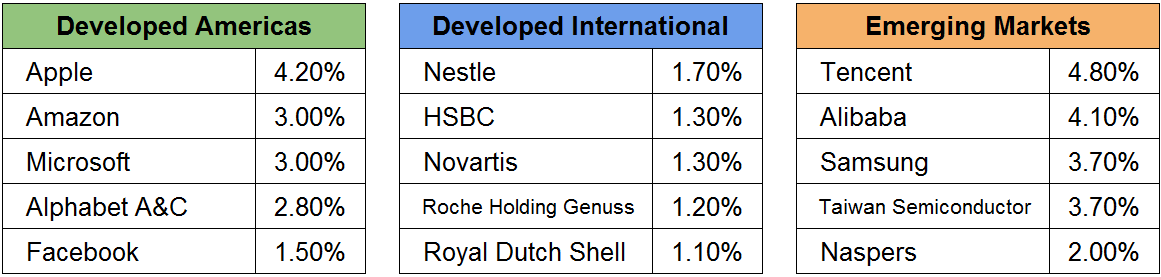
Keep in mind that these figures change over time as countries and companies increase or decrease in total market value, which is the (total number of shares) X (stock price). For example, here are the decade-to-decade changes in the top 5 largest US companies. We should expect this list to continue changing.

Each broad regional category of stocks is commonly referred to as an index. You can’t invest directly in an index, but you can invest in a mutual fund or ETF that attempts to replicate the index. They charge a fee for that work, so actual returns will always be a bit less than the posted index returns, which you will find in the charts below.
It is common to invest primarily or even exclusively in the country or region where you live. On average, US investors have most of their investments in the largest 500 US stocks, often called the S&P 500. This is referred to as ‘home bias’, and there are definitely some good reasons for it. The most obvious is that you take on currency risk investing in a different country. The exchange rate can moves against you before you sell the stock and your potential gain might turn into an actual loss. This can also work to your favor.
But there are compelling reasons to invest in other countries. They don’t all grow at the same rate at the same time, so you can add the possibility of higher returns than you might realize when only investing in your country. You can also reduce the unfortunate impact if you happen to be living in a country whose stock market goes through a sustained period of stagnation or decline.
Let’s look at how each regional stock market index has performed since the turn of the century and consider how this affects the way investors feel about investing globally. The charts below show the cumulative percentage change in the value of money invested in each market from the beginning to the end of the period. The summary figures before each chart are average compound annual returns, which indicate the % increase you would have had to receive every year during the period to equal the total change at the end. These are used for easier comparison.
2000 through 2009 (The Lost Decade)
US & Canada in Green 0.0%/yr
Developed International in Blue +1.2%/yr
Emerging in Orange +9.8%/yr
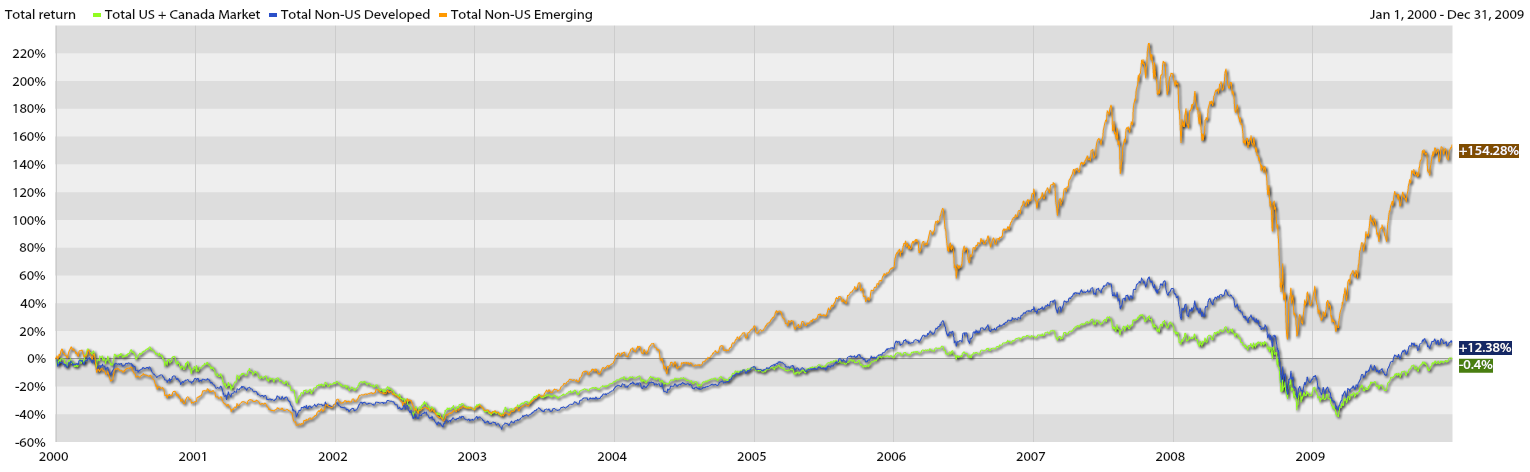
Grimly referred to as “The Lost Decade”, this era started with the dot-com bubble bursting and ended with the housing bubble bursting. We may want to forget about this painful period, but we should learn from it. The US stock market actually delivered slightly negative compound returns over a 10 year period! Meanwhile, disciplined emerging market investors had a wild ride and enjoyed compound annual returns of almost 10% per year.
Can you imagine if you earned nothing on your investments during the final 10 years of your career before retiring? That happened to many investors with only US-based stocks. At the end of this decade, an investor with 100% US stocks might have lamented missing out on positive returns, sold all of her US stocks and shifted to 100% emerging market stocks. Let’s see how that would have played out.
2010 through 8/31/2018
US & Canada in Green +12.72%/yr
Developed International in Blue +5.47%/yr
Emerging in Orange +3.22%/yr
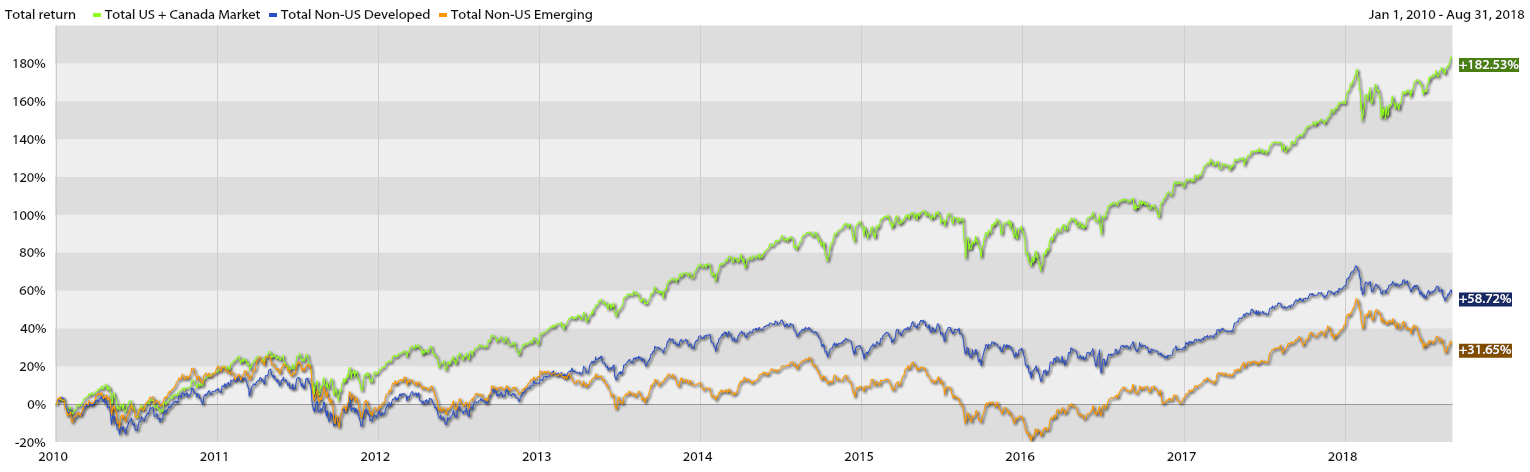
Since 2010 there has been a tremendous reversal of fortune compared to the Lost Decade. US and Canadian stocks made a steady recovery from the Great Recession while stocks of most other regions languished.
Our investor who shifted her portfolio from 100% US stocks to 100% emerging market stocks at the beginning of this decade is likely full of regret. It can be painful to learn that recent performance in stocks is not a useful guide for future performance. Let us not learn the hard way!
Putting both periods together: 2000 through 8/31/2018
US & Canada in Green +5.7%/yr
Developed International in Blue +3.2%/yr
Emerging in Orange +6.7/yr
Global Portfolio in Purple +5.6%
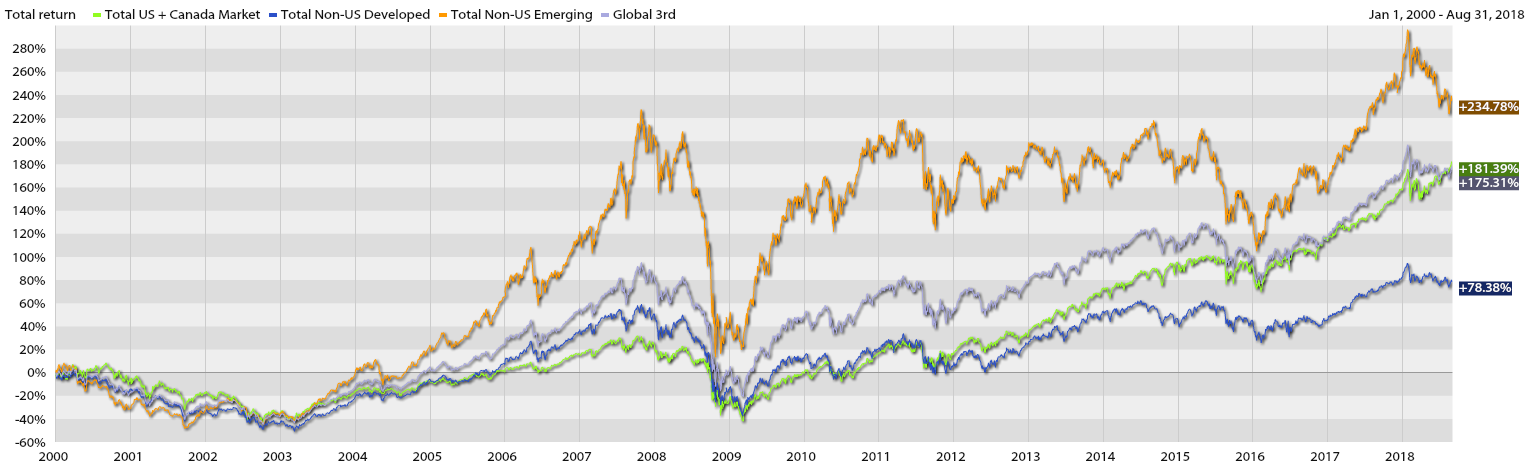
Now let’s combine the Lost Decade with the recovery of the past 8+ years and look at the compounding returns of the entire time span, rather than our previous separate decade-long windows. We immediately notice that international developed market stocks have lagged the other markets significantly. Should we assume this is a permanent condition? Will Europe, Japan and Australia suffer terrible returns indefinitely? Should we eliminate these markets from our portfolios entirely? Or, is it likely that international developed stock markets will eventually have a strong reversal? We cannot be certain, but I have good news: we can include these stocks and expect a competitive return from our total portfolio no matter the answer to those questions. This has been a reliable effect of diversification.
Notice the new Purple line representing a Global Portfolio. In this case, our investor would have allocated investments to ⅓ US & Canadian stocks, ⅓ international developed market stocks, and ⅓ emerging market stocks over this entire period. As you can see by the more middling path of the Purple line, she would have experienced much less heartburn and achieved a very reasonable rate of return over that entire time period.
Notice that even though international developed markets performed poorly during this period and she would have had ⅓ over her investments in those stocks using the Global Portfolio, the overall returns would have ended up very close to US & Canadian stocks and emerging market stocks. AND it was certainly possible that international developed market stocks could have performed better than they did. The reality is there was no way of knowing this on January 1st, 2000. A day on which we woke up happy that Y2K did not end the world. Likewise, there is no way of knowing which of these regions will perform best over the next decade.
Here are some takeaways from this analysis that might influence our investing…
- We cannot reliably predict which markets will outperform in the next decade.
- Over a long time, the differences between market returns become smaller.
- Markets that perform poorly for extended periods tend to rebound.
- There is no reliable method to anticipate the timing and duration of these reversals.
So… what is a reasonable investment strategy using these observations?
- Build a global portfolio that diversifies across broad market categories. The exact percentages can be debated, but this reduces the risk of missing the best performing markets and reduces the overall volatility of the portfolio.
- When certain markets decline severely, that is probably a good time to increase allocations to those markets because reversals are likely to happen eventually.
This year, so far. 1/1/2018 – 8/31/2018
US & Canada in Green +9.1%/yr
Developed International in Blue -2.3%/yr
Emerging in Orange -7.2%/yr
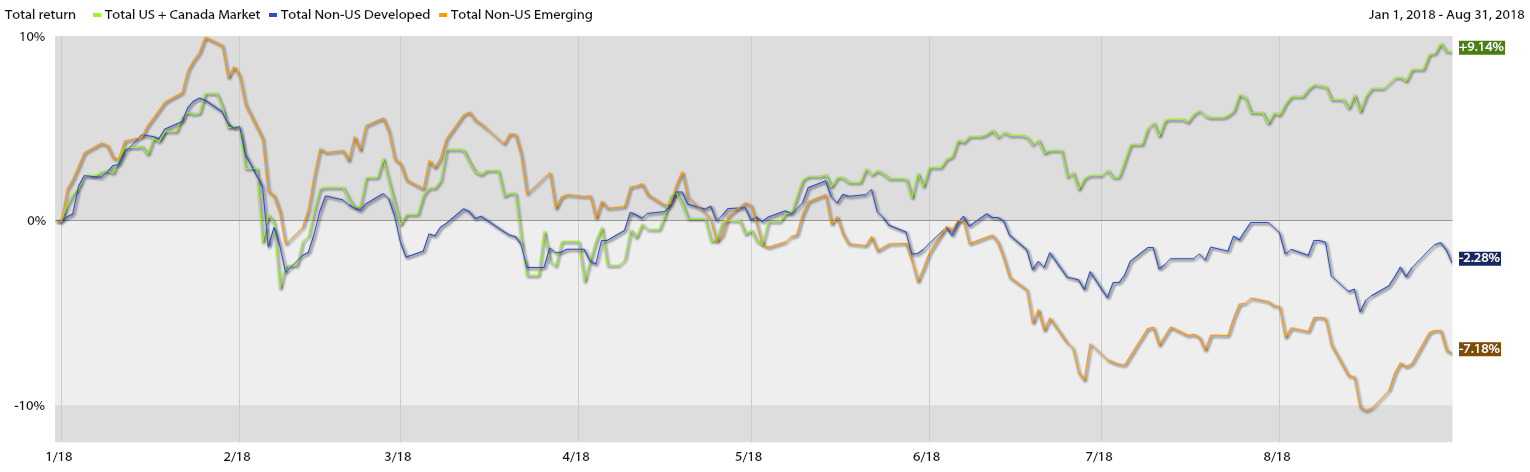
This recent divergence is astounding. Some analysts have suggested that the difference between US market returns and Non-US market returns this year are at extremes of historic magnitude. Perhaps the recent trade policies of the US have made an impact, but there are a multitude of other contributing factors. How do we apply our understanding of the history of markets to what is going on right now?
An investor might interpret this in a couple of different ways.
a) International stocks are sinking my ship. Sell them now and buy the high performing US & Canadian stocks!
b) International stocks are on sale! Sell some of the recent outperforming US & Canadian stocks and buy more international stocks!
Option a) feels right and satisfies the immediate desires to stop painful losses and not miss out on the gains others may have experienced. Success with this option requires markets to perform in even more unusual ways going forward. The odds of nailing the proper timing are low and the cost of being wrong is potentially quite high. Is it more likely this recent trend will continue or that markets will return to historical norms?
Option b) does not feel so good. It is a disciplined global strategy requiring consistent investments in all of these markets and rebalancing the portfolio by selling recent winners and buying recent losers. It does not require successful anticipation of the timing and severity of changes in markets. Instead, it allows investors to capture the long term average returns across all markets. In the moment, it might feel like going back to the restaurant that gave you food poisoning last week, and for that reason, fewer investors take this path.
Investing is hard! Just ask a friend who loaded up on Bitcoin and Tesla after returning home from Christmas break and hearing an uncle boast about his new fortune. Since then, Bitcoin crashed back to earth and Tesla got… weird. When it comes to investing the nest egg we will rely on for food, water and shelter in the future, we should separate ourselves from what makes investing fun and become familiar with the big picture. In this case, the entire global stock market over many years.
US & Canada Market index data
http://corporate1.morningstar.com/us/products/indexes/
Developed Markets index data
https://www.msci.com/documents/10199/4753a237-7f5a-4ef6-9f2b-9f46245402e6
Emerging Markets index data https://www.msci.com/documents/10199/c0db0a48-01f2-4ba9-ad01-226fd5678111
Return to Blog Page