
What does a -1.62% decline in the S&P on September 25th tell you?
September 26, 2014 | By Kevin Smith, CFA
It seems that whenever the daily price change of the stock market exceeds plus or minus 1%, the news headlines provide us with an indication that we should panic or rejoice. As you can see in the chart of daily S&P 500 price changes, we routinely observe activity between +2% and -2%.
Since the bottom of the stock market on March 9th, 2009 during our most recent recession, there have been 92 days in which the S&P 500 declined by more than -1.5%, which is almost 7 out of 100 trading days during our recovery. The odds of today’s price decline being an indicator of the next major downturn are about as good as any of the preceding 92, which would have all been wrong.
What should a -1.62% decline in the S&P on September 25th tell you? Not much. I encourage you not to support the bad habits of financial copywriters by clicking on articles related to modest daily price changes.
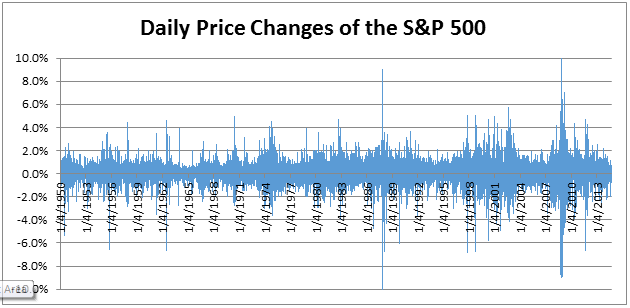
Source: Yahoo! Finance
Return to Blog Page